1、三维螺线例子:
   t=0:pi/50:10*pi;
   x=sin(t);y=cos(t);z=t;
   h=plot3(x,y,z);
   set(h,'LineWidth',4*get(h,'LineWidth'));
   grid
图像如下:
t=0:pi/50:10*pi;
x=sin(t);y=cos(t);z=t;
h=plot3(x,y,z);
set(h,'LineWidth',4*get(h,'LineWidth'));
grid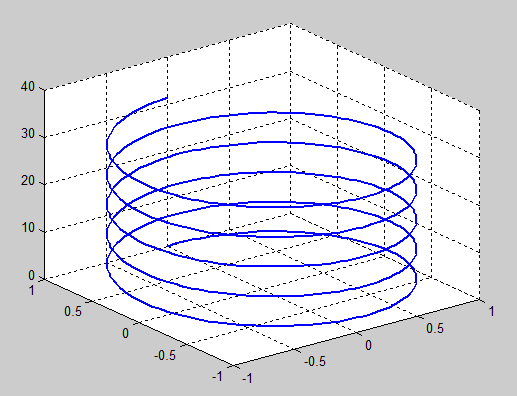
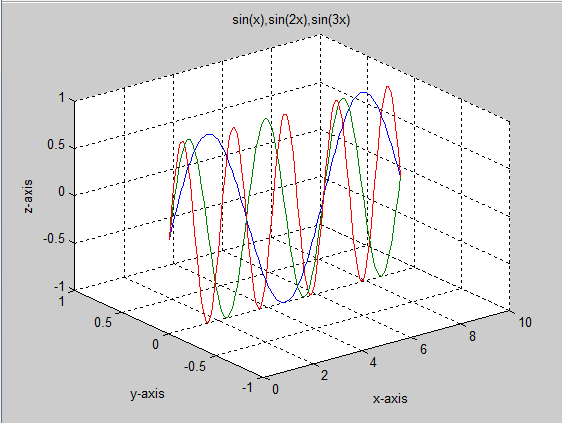
2、用plot3函数重叠绘制多条曲线
   x=linspace(0,3*pi);
   z1=sin(x);
   z2=sin(2*x);
   z3=sin(3*x);
   y1=zeros(size(x));
   y3=zeros(size(x));
   y2=y3/2;
   plot3(x,y1,z1,x,y2,z2,x,y3,z3);
   grid
   xlabel('x-axis');
   ylabel('y-axis');
   zlabel('z-axis');
   title('sin(x),sin(2x),sin(3x)');
图像如下:
x=linspace(0,3*pi);
z1=sin(x);
z2=sin(2*x);
z3=sin(3*x);
y1=zeros(size(x));
y3=zeros(size(x));
y2=y3/2;
plot3(x,y1,z1,x,y2,z2,x,y3,z3);
grid
xlabel('x-axis');
ylabel('y-axis');
zlabel('z-axis');
title('sin(x),sin(2x),sin(3x)');
3、三维网格图:
   [x,y,z]=peaks(30);
   mesh(x,y,z);
   grid;
   xlabel('x-axis');,ylabel('y-axis'),zlabel('z-axis');
   title('MESH of PEAKS');
图像如下:
[x,y,z]=peaks(30);
mesh(x,y,z);
grid;
xlabel('x-axis');,ylabel('y-axis'),zlabel('z-axis');
title('MESH of PEAKS');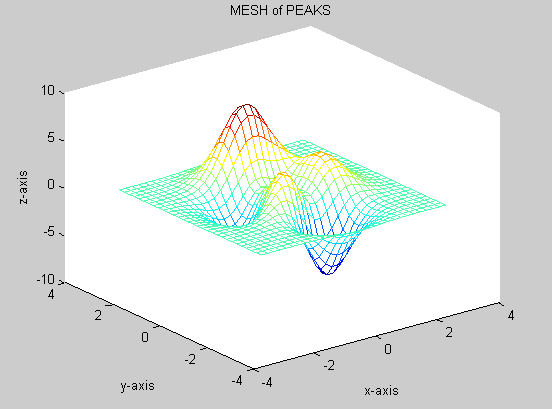
  [x,y,z]=peaks;
  subplot(221);
  meshz(x,y,z);
  axis([-inf inf -inf inf -inf inf]);
  subplot(222);
  waterfall(x,y,z);
  axis([-inf inf -inf inf -inf inf]);
  subplot(223);
  meshc(x,y,z);
  axis([-inf inf -inf inf -inf inf]);
  subplot(224);
  surfc(x,y,z);
  axis([-inf inf -inf inf -inf inf]);
图像如下:
[x,y,z]=peaks;
subplot(221);
meshz(x,y,z);
axis([-inf inf -inf inf -inf inf]);
subplot(222);
waterfall(x,y,z);
axis([-inf inf -inf inf -inf inf]);
subplot(223);
meshc(x,y,z);
axis([-inf inf -inf inf -inf inf]);
subplot(224);
surfc(x,y,z);
axis([-inf inf -inf inf -inf inf]);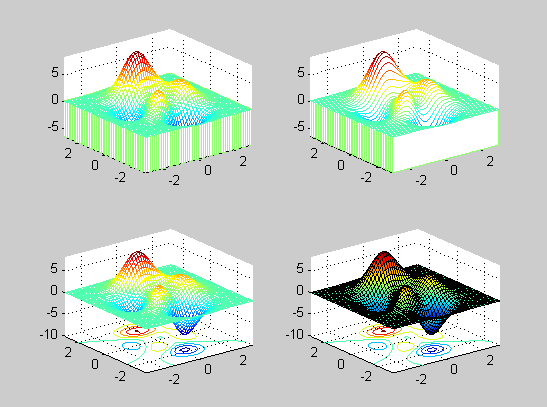
4、三维曲面图
   [x,y,z]=peaks(30);
   surf(x,y,z);
   grid
   xlabel('x-axis');,ylabel('y-axis'),zlabel('z-axis');
   title('SURF of PEAKS');
图像如下:
[x,y,z]=peaks(30);
surf(x,y,z);
grid
xlabel('x-axis');,ylabel('y-axis'),zlabel('z-axis');
title('SURF of PEAKS');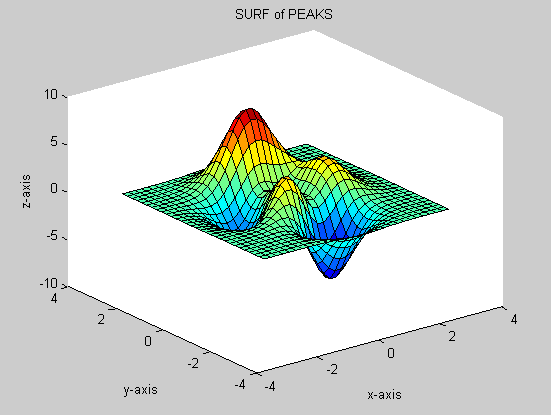
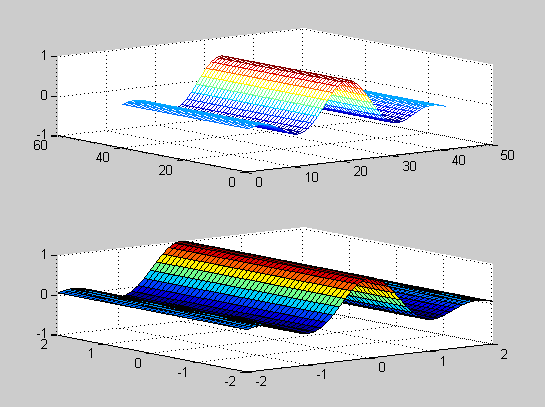
mesh和surf的显示比较
  x=-2:0.1:2;
  [x,y]=meshgrid(x,x);
  r=sqrt(x.^2+x.^2)+eps;
  z=sinc(r);
  subplot(211);
  mesh(z);
  subplot(212);
  surf(x,y,z);
图像如下:
x=-2:0.1:2;
[x,y]=meshgrid(x,x);
r=sqrt(x.^2+x.^2)+eps;
z=sinc(r);
subplot(211);
mesh(z);
subplot(212);
surf(x,y,z);